What is AWS Lambda Console
This console aids the user in monitoring and managing their Lambda apps. The Applications menu:
– Displays a list of CloudFormation stacks with their Lambda functions
– Contains stacks that are launched by the user in CloudFormation through using one of the following:
CloudFormation console
AWS Serverless Application Repository
AWS CLI
AWS SAM CLI
For Viewing a Lambda App
- Head to the Lambda console Applications page.
- Select an app.

aws lambda console – select an app
This will allow you to check the below information about your chosen app.
- AWS CloudFormation templateor SAM template: This template is a definition of your app.
- Resources: These are your AWS resources which get defined within the app’s template. For the sake of managing your app’s Lambda functions, select from the list one of the function names.
How to Monitor Apps?
Monitoring tab: previews a CloudWatch dashboard that has aggregate metrics which are for all resources found in your app.
Monitoring a Lambda app
- Head to the Lambda console Applications page.
- Select Monitoring.
A basic dashboard will be shown by default through the Lambda console. This page may be customized through the defining of custom dashboards in your app template. When multiple dashboards are included by your template, your dashboards shall be displayed by the page instead a default dashboard. The dropdown menu can be used for switching between dashboards from the top right.
Monitoring Dashboards (Custom)
You are capable of customizing your app monitoring page through the addition of 1 or more CloudWatch dashboards to your chosen app template with the help of AWS::CloudWatch::Dashboard resource type. The bellow mentioned example is used for creating a dashboard with just one widget which graphs the value of invocations made by a function that is named my-function.
Example
Resources:
MyDashboard:
Type: AWS::CloudWatch::Dashboard
Properties:
DashboardName: my-dashboard
DashboardBody: |
{
“widgets”: [
{
“type”: “metric”,
“width”: 12,
“height”: 6,
“properties”: {
“metrics”: [
[
“AWS/Lambda”,
“Invocations”,
“FunctionName”,
“my-function”,
{
“stat”: “Sum”,
“label”: “MyFunction”
}
],
[
{
“expression”: “SUM(METRICS())”,
“label”: “Total Invocations”
}
]
],
“region”: “us-east-1”,
“title”: “Invocations”,
“view”: “timeSeries”,
“stacked”: false
}
}
]
}
It is possible to get the definition of one of your widgets that are found in the default monitoring dashboard through using the CloudWatch console.
Viewing widget definition
- Go to the Lambda console Applications page.
- Select one of the applications which has a standard dashboard.
- Select Monitoring.
- On any of the widgets, click on the option View in metrics[drop-down menu].
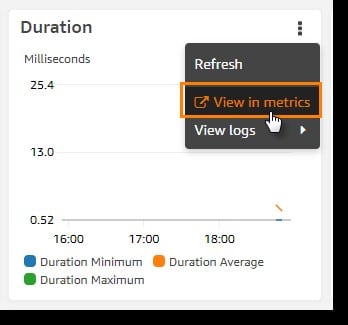
aws lambda console – view in metrics
- Select Source.
How to Create an Application on AWS Lambda Console?
Creating applications using Lambda console.
Creating an app
- Go to the Lambda console Apps page.
- Select Create application.
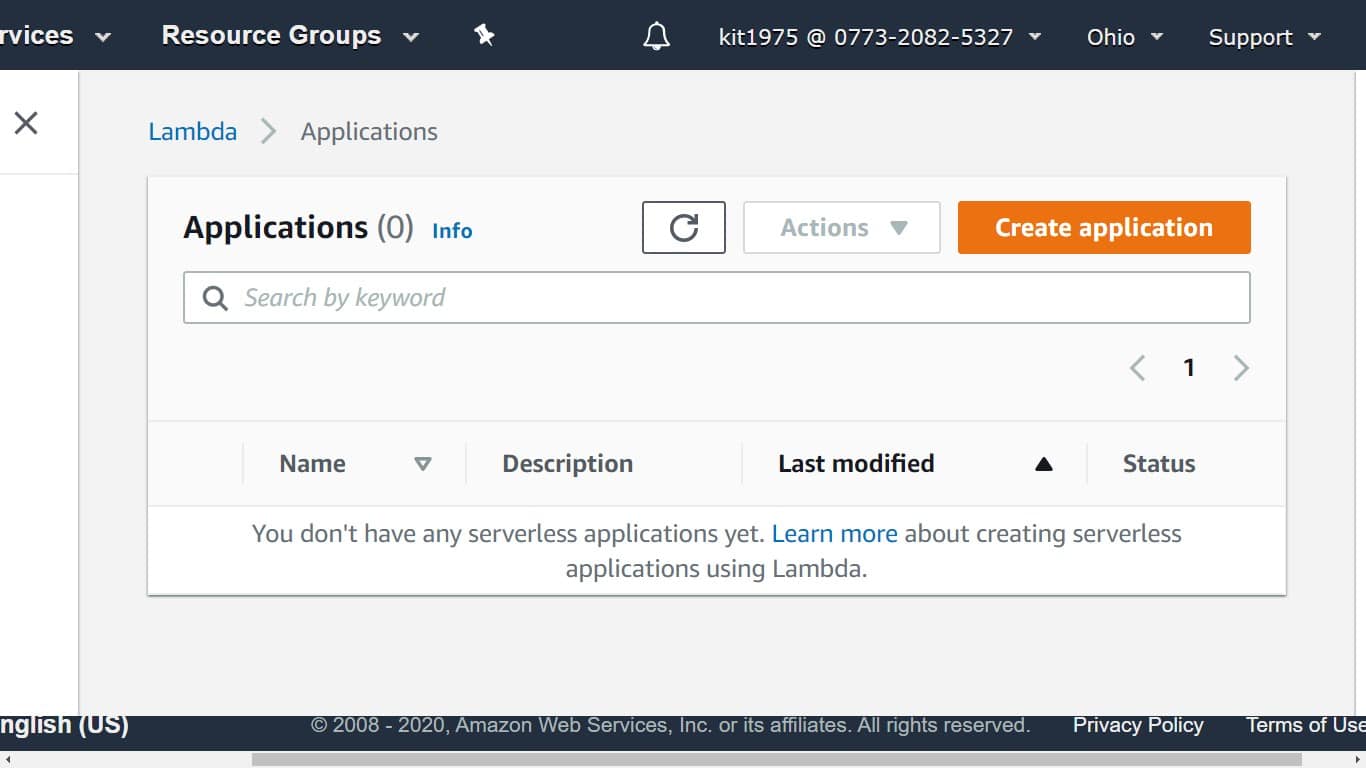
aws lambda console – create application
- Select Author from scratch.
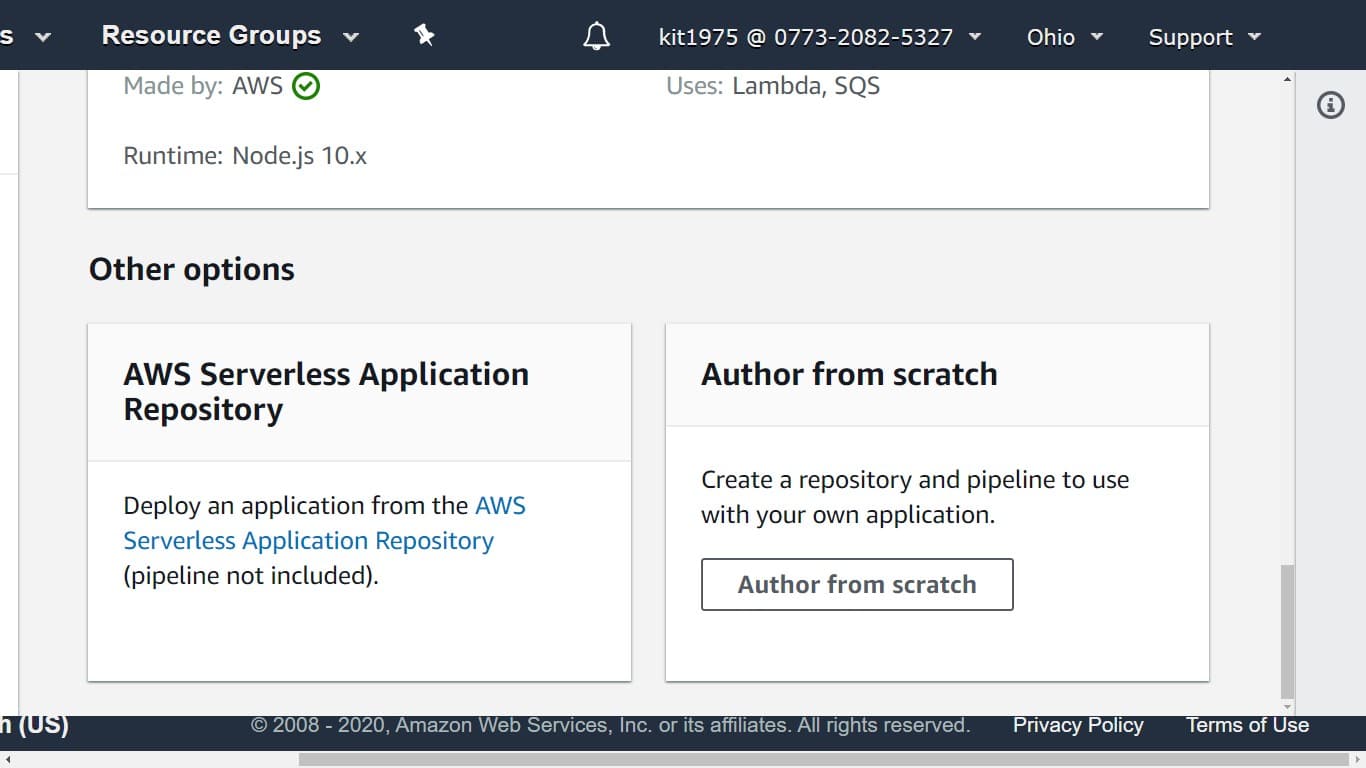
aws lambda console – author from scratch
- Start configuring application settings.

aws lambda console – application details
- Application name: my-app.
- Application description: my application.

aws lambda console – function configuration
- Runtime: js 10.x.
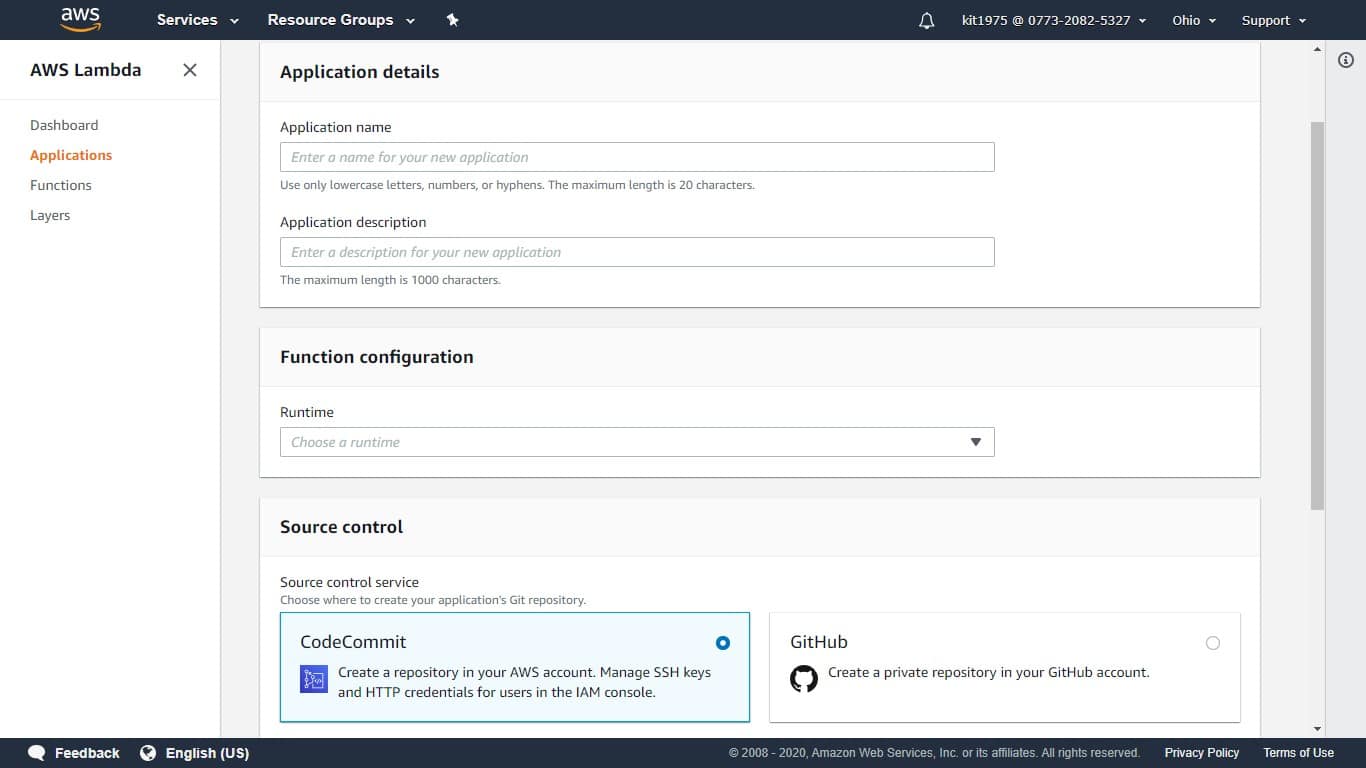
aws lambda console – source control
- Source control service: CodeCommit.
- Repository name: my-app-repo.
- Permissions: Create roles and permissions boundary.
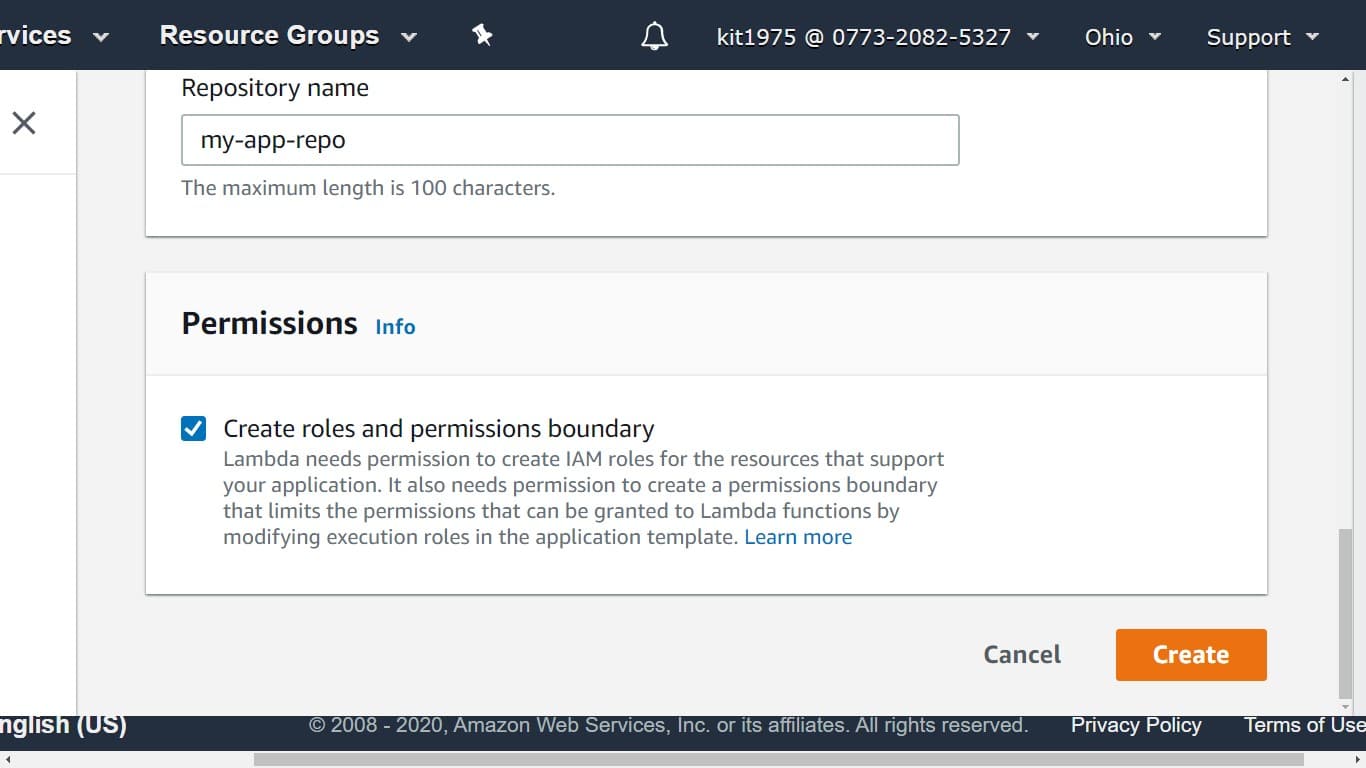
aws lambda console – permissions
- Click on Create.
Lambda:
– Creates the pipeline
– Creates related resources
– Commits the sample app code to the Git repository
When resources get created, they will start appearing on your overview page.
How to Invoke the Function?
Invoking the function is used for verifying that this function actually works.
Invoking the app’s function
- Go to the Lambda console Applications page.
- Select my-app.
- From below Resources, select helloFromLambdaFunction.
- Click on Test.
- Start by configuring a test event.
- Event name: test
- Body: {}
- Click Create.
- Select Test.
Your Lambda console will now execute your chosen function and show its result. For checking the output of the function and its execution details, go ahead and expand the Details section found below the result.